


 Are you planning a portable radio adventure (POTA, SOTA, BOTA, etc.)?
More than once I’ve ventured out, spent a few minutes setting up (or much longer when it’s been a new antenna configuration), then spun the dial in eagerness only to hear: hsssssssss! No contacts. Nothing 🥲
Regardless of going QRP (low-power operation ≤ 5-10 watts) or QRO (high-power operation), spending just a few minutes of propagation preparation can mean the difference between enjoying a day of QSO activity & pileups, and spending it on a quiet hilltop watching the cows munch grass.
It’s best to think of RF propagation data as being our helpful guide to going portable, rather than it offering a strict “yes” or “no” conclusion. Understanding the data helps us appreciate the conditions we’ll be facing, and as amateur radio operators, we can still go out and conduct our activities knowing what we’ll be dealing with beforehand.
In short:
- Check the solar data (ionosphere condition).
- Check the band activity and DX Clusters & Spots (who’s making QSOs).
1) The Solar Mood: Watch the Space Weather
For DX (long-distance contacts), we need the ionosphere to refract and reflect back down the earth the radio waves we transmit. Unfortunately for amateur radio operators, the ionosphere is temperamental, as its behaviour is primarily affected by the Sun’s energy. Sometimes the ionosphere works for us and sometimes it’s against us.
To see if the ionosphere is working for us today, we take a glance at solar data, telling us several key parameters that affect HF bands.
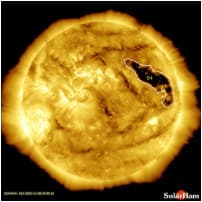
visit SolarHam.net for a complete dashboard of space weather.
We pay attention to the Solar Flux Index (SFI) and K-index:
- SFI above 120 (higher is better ≥120) → higher numbers usually mean better propagation for the higher-band HF bands.
- K-index/Kp-index of under 3 (lower is better ≤2) → value of 2 and under suggests calm, stable conditions.
SolarHam.net also has a 3-day prediction at https://www.solarham.com/geo_forecast.htm, allowing us to plan future expeditions. The more green bars, the better the HF/DX conditions will be for us.
Solar Data Explained
We can determine favourable conditions for HF DXing by understanding the measurements that depict the sun’s behaviour.
- Solar Flux Index (SFI) (higher is better ≥120):
Shown as “SFI” on the SolarHam page. Higher values are generally good for ionospheric propagation – especially for higher HF bands. - Sunspot Number (SSN) (higher is better):
More sunspots → generally better ionisation for HF propagation. - K-index / Kp (geomagnetic indices) (lower is better ≤2). (0-2 → quiet geomagnetic field, 3-4 → unsettled to active, ≥ 5 → minor to major geomagnetic storm). If the K-index rises, expect shortwave turbulence; even solid bands such as 40m can wobble.
On SolarHam you’ll see K-index charts; high Kp means geomagnetic storm conditions. - Solar wind speed (lower is better) / Bz (positive/northward is good) / CME alerts (fewer is better):
On SolarHam there are wind speed values and alerts like “incoming CME” etc. For example: “Solar wind speed is now near 800 km/s.” - Flare events / radio-blackout risk (fewer is better):
The site lists recent solar flares (M-class, X-class) and radio burst risks. When a flare happens, the sudden burst of X-rays over-ionises the D-layer (the lowest layer of the ionosphere). The D-layer normally absorbs some HF signals, but during a flare the layer becomes super-absorbent, killing off lower-frequency (HF) propagation.
2) See the Bands Breathing: Real-Time Activity Maps
discover which bands are alive by seeing the activity of real operators in near-real time:
- DX Heat – live DX cluster heatmap showing active bands and modes.
- DXView – HF real-time propagation maps. Shows where signals are being heard and which bands are currently active.
- HamDXMap – a live world map that shows parameters like MUF (maximum usable frequency), foF2 (critical frequency of the F2 layer) and aurora overlay.
- DX Maps – provides real‑time spots / reception reports for amateur radio and shortwave listening. Particularly useful to see actual reported QSOs/receives rather than just propagation estimates.
- PSKReporter – digital mode activity maps showing where signals are actually being received. If you see FT8 spots crisscrossing the oceans, chances are your voice will get through too.
3) Predict the Future: Plan with VOACAP
when you’d rather forecast than guess, try VOACAP Online.
Voice of America Coverage Analysis Program (VOACAP) predicts which HF bands will be open from your QTH to specific regions. Enter your location, antenna, mode and power level, and you’ll get a propagation forecast chart – your personal radio weather map.
For ease of finding it, here’s the VOACAP User Manual PDF: https://www.voacap.com/2023/documents/VOACAP_Manual.pdf
Understanding a VOACAP propagation prediction map
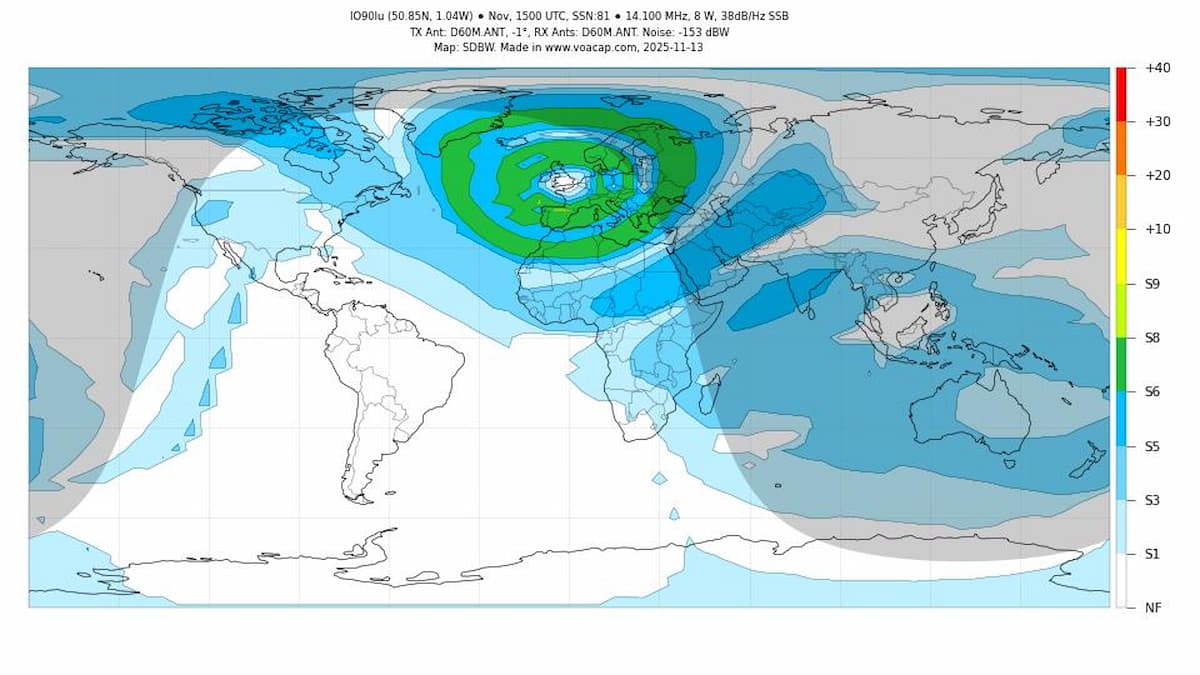
From VOACAP.com’s “Coverage Map” menu, here’s an example “Signal-to-noise ratio in DB” map from South England. It shows expected signal strengths if I were transmitting on 8W, 20M, SSB, on 13th November, 2025. The map predicts how well my signal would propagate from my transmitter location to the rest of the world.
A visual representation of when TX’ing on 20m wondering why no-one outside of Europe was hearing me.
Reading the Map’s Colours
The colour scale (right of the image) shows expected signal strength above noise (in dB):
VOACAP Prediction Map
| Colour… | Approx. Signal Strength… | Meaning… |
|---|---|---|
| Red / Orange | +30 to +40 dB | Extremely strong (local/nearby) |
| Yellow | +10 dB | Good to strong |
| Green | 0 to +10 dB | Fair to good |
| Blue shades | Below 0 dB | Weak to poor |
| Grey / White | NF (No Frequency) | No usable propagation |
Interpreting This Specific Map
At 14.100 MHz and 15 UTC on 13th November, 2025:
- The strongest area (green/yellow zone) surrounds northern Europe — strong daytime 20m propagation.
- Southern Europe, Russia, and parts of North Africa still get usable signals (S5–S7 equivalent).
- Asia and the Americas are mostly blue/grey, meaning weak or no reliable contact at that time and frequency.
- This corresponds with the daylight footprint – the 20 m band is primarily open in daylight.
Summary in Practical Terms
If I were transmitting from southern England (IO90lu) at 14.100 MHz and 15 UTC:
- I’d expect good QSOs (contacts) across the UK, Scandinavia, and nearby Europe.
- I’d expect possible but weaker paths to Southern Europe or Western Russia.
- I’d have very little chance of reaching North America or East Asia at that time on 14 MHz with 8 W SSB.
4) Tap into the Human Network: DX Clusters and Spots
propagation numbers are theory, but spots are proof.
See what real operators are hearing:
- DX Summit and DXWatch – live DX cluster feeds from around the world.
- POTA Spots – who’s activating which park, on what band, and in what mode.
If 40 m is full of activators, you’ll know where the crowd is.
5) Check Reverse Beacons: Who’s Hearing Whom
Before heading out, test your reach.
CW and digital (only) operators can use the Reverse Beacon Network (RBN) to see where their signals are received in real time. A quick CQ from home can reveal which bands are open to your target regions.
6) Field Intel: Apps and Tools for the Road
Keep the data handy while operating portable:
- HamAlert – receive push notifications when your callsign, park reference, or favourite DX appears on cluster spots.
- WSPRnet – see global weak-signal propagation in near real time (may need to create an account to log in).
- POTA Map – visualise active and upcoming park activations around you.
7) Smartphone Apps
most of the available data is available on smartphones.

1. DX Toolbox (iOS)
- This app provides several propagation-forecasting tools: you can estimate HF (shortwave) conditions between any two locations, view MUF/LUF graphs, grey-line maps, etc.
- Good for planning: pick your QTH (your location) and a target region, and see when the band might open.
- Caveat: iOS only (in this listing) and may cost a few $/£.
2. Ham Solar (Android)
- Described as a tool to show current HF propagation predictions and solar/space weather data.
- Useful for a quick check: e.g., see if solar indices are “good” or “bad” for HF before you leave.
- Caveat: user reviews mention some functions, such as maps or web content, may have reliability issues.
 3. Ham and More (Android)

- Offers a suite of tools including HF propagation prediction calculations (runs locally), reference material (antenna, conversions, maidenhead locator), and Morse code training.
- Advantage: you don’t necessarily need internet connectivity for the predictions (if pre-loaded), which is handy in remote locations.
- Caveat: As with many small apps, it may lack polish or ongoing updates.
4. HF Propagation (Android)
- This app displays solar data and HF propagation information; it is essentially a mobile front end for solar/ionospheric data.
- Useful for checking right now how the bands are behaving.
- Caveat: simpler / fewer features compared to full desktop tools.
8) Quick Rules of Thumb Before You Go

- SFI > 120 (higher is better) → a high solar flux means the upper bands (20m, 17m, 15m, 12m, 10m) are likely to be open.
- K ≤ 2 (lower is better) → low K-index meaning calm geomagnetic conditions with fewer disturbances.
- Greyline times (sunrise/sunset) → the greyline enhances long-distance propagation (DXing) on 40m and 80m.
- FT8 activity = proves open paths (e.g., checking on PSKReporter) even when SSB sounds quiet.
- Higher bands (20m, 17m, 15m, 12m, 10m) work better during the day, especially with high solar activity.
- Lower bands (160m, 80m, 40m) are best at night and during winter.
- Take several batteries to give yourself several hours of operation if needed.
- Multiple antennas may help – such as an asymmetric dipole, a vertical one, or a simple wire antenna (EFHW / Random Wire).
- Prepare to spend 3 to 4 hours getting an activation done.
- Ensure your phone is fully charged.
- Take a pulley to allow you to hoist your mobile phone up a mast to ‘spot’ yourself if you’re in a poor signal spot.
- Ask contacts to spot you on POTA or DX cluster (etc.) if struggling.
- Post on a couple of WhatsApp groups, social media groups, and your local amateur radio club’s forum (if allowed).
The Bottom Line
Portable radio is part adventure, part science experiment. A few minutes of checking propagation conditions before leaving home can help us transform luck into strategy.
Learning to read the ionospheric weather means we can spend less time calling CQ into the void and more time logging contacts.
The Sun is our silent partner, and we can learn what kind of mood it’s in before venturing outdoors.
—
(Contributions gratefully received from the South Coast Radio Activators Group),
73/Dean M7SUX


Contents
- 1 1) The Solar Mood: Watch the Space Weather
- 2 2) See the Bands Breathing: Real-Time Activity Maps
- 3 3) Predict the Future: Plan with VOACAP
- 4 4) Tap into the Human Network: DX Clusters and Spots
- 5 5) Check Reverse Beacons: Who’s Hearing Whom
- 6 6) Field Intel: Apps and Tools for the Road
- 7 7) Smartphone Apps
- 8 8) Quick Rules of Thumb Before You Go
- 9 Related Tips
- 10 The Bottom Line
0 Comments